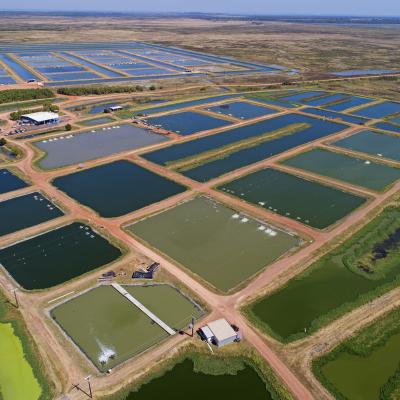
This case study focused on how the agriculture sector in the Darwin study area has changed since the beginning of the century, what are the key components of the agriculture sector, and what we can learn from the past to make informed decisions for the future.
Agriculture in the Darwin study area grew from $129 million to $231 million in the 15 years studied (2001-02 to 2015-16), an increase of 79%. By contrast, all other industry sectors grew 59% over the same period in the study area. Agriculture developed along multiple pathways and in many ways. It developed “under the radar” and is a success story of northern development.
Several agriculture sectors dominated in the early 2000's, but there is now a diverse array of agricultural industries contributing to this growth. Importantly, the agricultural services sector grew markedly during the period considered in the study. Poor access to agricultural services is often identified as a constraint to northern development. The growth of this sector shows that some of the constraints have been removed as the industry has matured. More than half of the new agricultural jobs created were in the agricultural services sector.
The mantra of “start small and grow big” has been used with success in the Darwin study area. However, history has shown that private agricultural schemes are at high risk of failure in northern Australia. This study showed that business turnover was high and the failure rate for individual businesses suggests that those investing in agriculture in the Darwin study area face significant challenges.
Businesses that did survive continued to grow. They almost certainly began with higher amounts of initial capital than those that failed. So while “starting small” was a common theme, “starting strong” was a key to success.


